From September 15 to October 15, we celebrate Hispanic Heritage Month, a time to honor the diverse histories, cultures, and contributions of Hispanic communities across the United States. Here in Massachusetts, Hispanic residents are a vital part of the state’s identity, shaping its neighborhoods, workplaces, schools, and cultural life.
To celebrate, we’re sharing a snapshot of Census data that highlights where Hispanic residents live, their diverse backgrounds, and details about age, income, and occupations. These numbers help paint a picture of a community that is rooted and growing.
A Statewide Presence
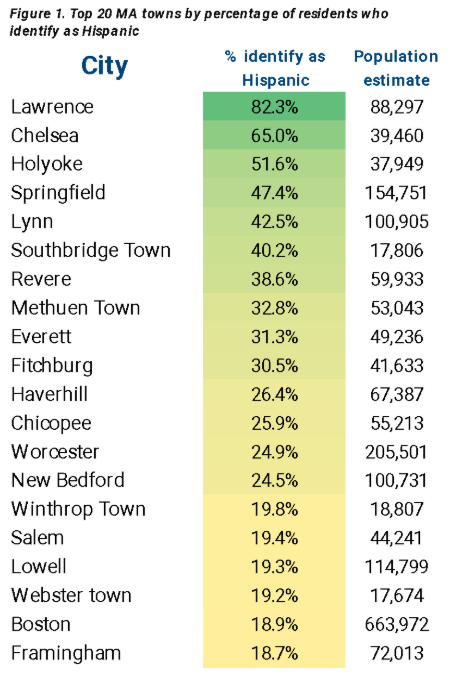
According to the most recent Census data (American Community Survey, 5-Year 2023), 904,679 residents in Massachusetts identify as Hispanic. That is 13% of the state’s total population of nearly 7 million. Hispanic residents live in every corner of the state, and in 43 cities and towns they make up at least 10% of the population.
In some communities, Hispanic residents form a majority. Lawrence, Chelsea, and Holyoke all have Hispanic populations that outnumber other groups. Other cities, including Springfield, Lynn, Southbridge, Revere, Methuen, Everett, and Fitchburg, have Hispanic populations ranging from one-third to nearly one-half of all residents.
Deep Roots, Wide Diversity
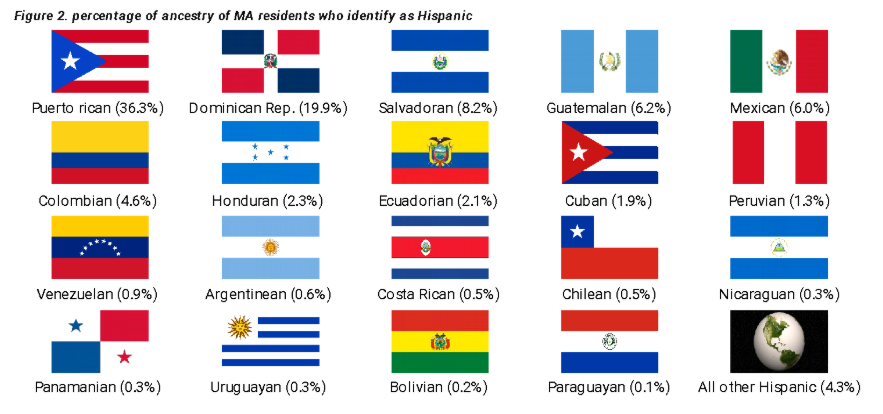
Massachusetts’ Hispanic community is not new. Puerto Rican, Dominican, and Salvadoran families, among others, have lived here for decades, building community institutions and shaping local culture. At the same time, the state continues to welcome residents with ancestry from across Latin America. This mix makes the community uniquely diverse, dynamic and vibrant.
Identity and Representation
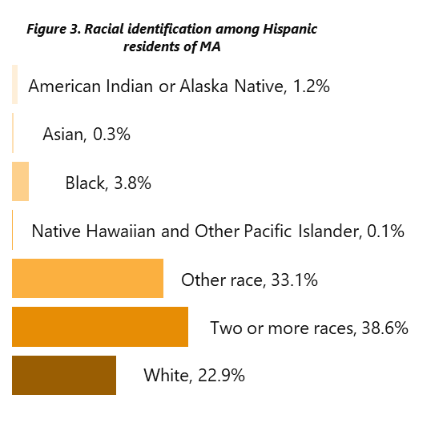
Hispanic residents in Massachusetts also reflect the diversity of racial identities within the community. The most common racial identification is “Two or more races,” followed by “Other race” and “White.” This diversity highlights how racial and ethnic identity overlaps with the community’s varied origins and ancestries.
A Young and Growing Population
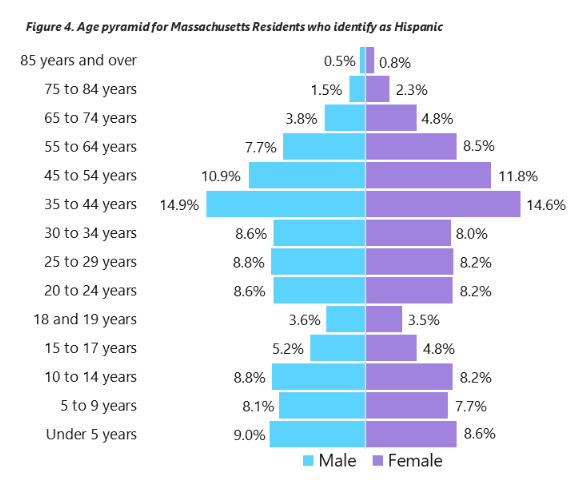
The Hispanic community in Massachusetts is young. The median age is 29.6 years, with women slightly older on average (30.4) than men (28.8). The largest age group is 35–44 years old. This profile shows how Hispanic residents are shaping, and will continue to shape, the future of Massachusetts in schools, neighborhoods, and the workforce.
Work and Opportunity
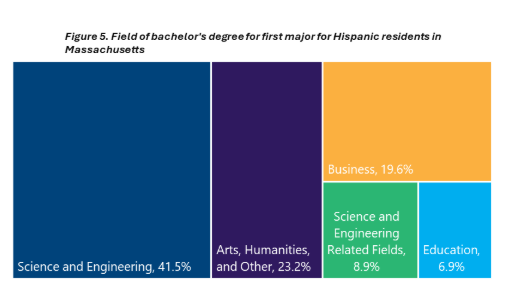 Hispanic residents are also making their mark in Massachusetts’ workforce and economy. The median family income is $68,688, and residents work in a wide range of occupations. At the same time, many are pursuing higher education in diverse fields. Census data show that Hispanic adults with a bachelor’s degree most often studied areas such as science and engineering, arts and humanities, and other professional disciplines, contributing to the state’s workforce, innovation, and cultural life.
Honoring the Present and Future
Massachusetts’ Hispanic communities are diverse, dynamic, resilient, and essential to the state’s story and future. From long-established families to newer arrivals, they bring energy, traditions, and vision that enrich the Commonwealth. As we celebrate Hispanic Heritage Month, we recognize not only the history of these communities but also their presence, and role in shaping the future of Massachusetts.
Source
U.S. Census Bureau, 2019–2023 American Community Survey 5-Year Estimates for Massachusetts overall and for all cities and towns.
Tables:
- B01001I: Sex by Age (Hispanic or Latino)
- B01002I: Median Age by Sex (Hispanic or Latino)
- B03001: Hispanic or Latino Origin by Specific Origin
- B03002: Hispanic or Latino Origin by Race
- B03003: Hispanic or Latino Origin
- B19113I: Median Family Income (Hispanic or Latino Householder)
- C15010I: Field of Bachelor’s Degree for First Major (Hispanic or Latino)